Sales report: revenue, orders, best sellers, peak hours
Open Analytics › Sales on the web, or Control Center › Sales in the Ordavya Admin app. Pick a period to see revenue, orders, average order, top products, peak hours, where orders came from and who ordered, each compared with the period before.
Aktualisiert am 20. November 2026Wo Sie es finden
- Analytics
- Sales
- Control Center
- Sales
Sie brauchen: Owner, or staff with Sales reports access.
The Sales report shows sales, orders and best sellers over time. Every number is compared with the period before, for example vs last week for Last 7 days.
Overview
| Number | What it means |
|---|---|
| Revenue | The total of orders in the period. |
| Orders | How many orders were placed. |
| Average order | Revenue divided by orders. |
| Canceled | Orders that were cancelled. |
| Conversion rate | The share of visits that placed an order. Shown once you have visitor data. |
Click any of these numbers to see the orders behind it.
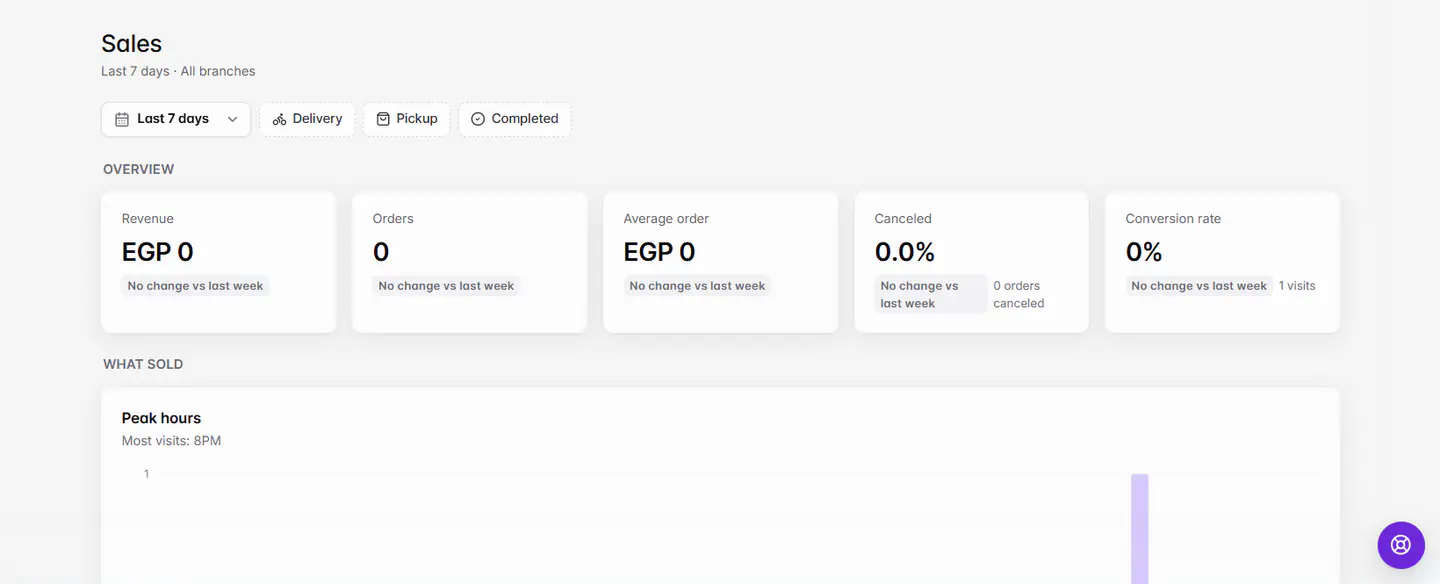
The sections
| Section | What's in it |
|---|---|
| What sold | Revenue & orders by day, Peak hours and Top products by revenue. With visitor data, top products also show Views and Add rate. |
| Where it came from | Sales by source (orders from your website and app, by how the visit arrived), Pickup vs delivery and Branches. |
| Who ordered | New vs Returning customers, Repeat rate, Top customers by spend and Abandoned carts. |
| Service | Service time: how long orders took To accept and To complete, and Cancellations by reason. |
Filters
Choose a period: Today, Yesterday, Last 7 days, Last 30 days, This month, Last month or Last 90 days. Narrow it to Delivery or Pickup, and switch between All orders and Completed orders only. To see one branch, pick it in the branch switcher. Read more in Filter reports by branch, channel and date.
In the Ordavya Admin app
Control Center › Sales has the same periods and sections, with All, Delivery or Pickup and All orders or Completed orders only. The Dashboard tab also shows a quick sales summary for today, 7 days or 30 days, with Best day and Busiest hour.
Wenn etwas nicht klappt
Meldungen, die Sie sehen könnten, und was zu tun ist.
Couldn't load analytics. Check your connection.
Check your internet connection and reload. See A page or chart didn't load.
No branch is assigned to your account. Ask the store owner to assign one.
You're limited to branches but have none. The owner can add one in Settings › Staff & access.
No orders in this period
Pick a longer period, or check the branch and order-type filters.
Häufige Fragen
Why don't I see Conversion rate?
It appears once your website or app has visitor data. See Visitors.