Conversion: from visit to order
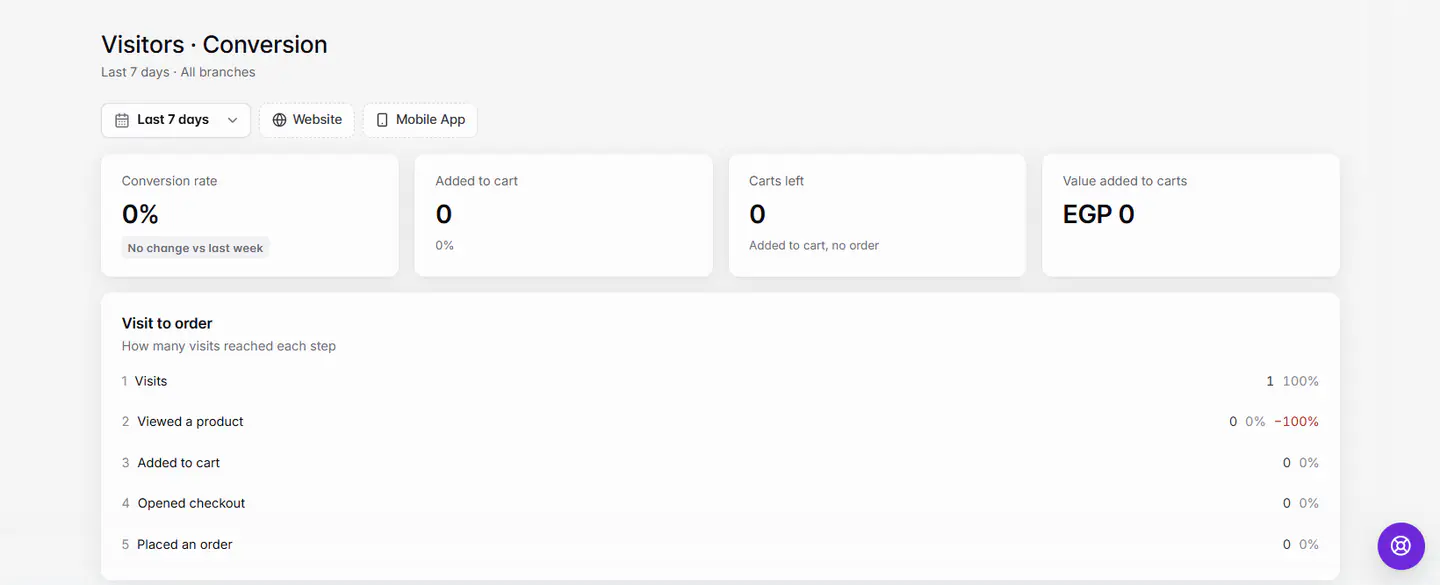
Open Analytics › Visitors › Conversion. It shows your Conversion rate, carts left without an order, and a Visit to order funnel: visits, viewed a product, added to cart, opened checkout, placed an order.
Updated 20 November 2026Where to find it
- Analytics
- Visitors
- Conversion
- Control Center
- Visitors
- Conversion
You need: Owner, or staff with Visitors access.
Conversion tells you how many visits turn into orders, and where the rest stop. Choose a period and Website and app, Website or Mobile App at the top.
The numbers
| Number | What it means |
|---|---|
| Conversion rate | Visits that placed an order, as a share of all visits, compared with the period before. |
| Added to cart | Visits that added at least one item, and their share of all visits. |
| Carts left | Added to cart, no order. |
| Value added to carts | The total value of items added to carts in the period. |
The Visit to order funnel
Visit to order shows how many visits reached each step. Each bar shows the count, its share of all visits, and in red how many dropped off since the step before.
- 1VisitsEveryone who opened your website or app.
- 2Viewed a productVisits that opened at least one product.
- 3Added to cartVisits that put something in the cart.
- 4Opened checkoutVisits that went to checkout.
- 5Placed an orderVisits that finished an order.
What to do about big drop-offs
| Big drop between | Things to check |
|---|---|
| Visits → Viewed a product | Is your menu easy to find on the home page? Check Landing pages under Behavior. |
| Viewed a product → Added to cart | Photos, descriptions and prices. Products viewed vs added to cart shows which items need work. |
| Added to cart → Opened checkout | Delivery fees and minimum order. See Delivery fees and minimums. |
| Opened checkout → Placed an order | Delivery areas, sign-in and payment options. See Customers can't place an order. |
The Sales report also shows Conversion rate and Abandoned carts, so you can compare them with revenue. See Sales report. After you change something, compare the same period length before and after to see if the drop-off shrank.
If something goes wrong
The messages you might see, and what to do.
No visits in this period
Pick a longer period, or check the channel filter.
Couldn't load visitors. Check your connection.
Check your internet connection and reload.